
In 2024, Indonesia ranked 3rd in the world for crypto adoption, according to the Chainalysis Global Crypto Adoption Index — up from 7th the year before, trailing only India and Nigeria, and leading every market in Southeast Asia.
That same year, Indonesian crypto transactions exceeded $30 billion, representing a 352% increase from the prior year — nearly three times the pace of global market growth, which expanded approximately 131% over the same period.
Comparative Table: 2025 Global Crypto Adoption Index (SEA Focus)
| Country | Global Rank | Key Characteristic |
|---|---|---|
| Vietnam | 4 | High retail ownership (21%); Strong P2P usage. |
| Indonesia | 7 | Highest volume growth (~350%); High DEX usage. |
| Philippines | 9 | Driven by Remittances and Gaming. |
| Thailand | 17 | High ownership but declining institutional volume. |
| Cambodia | 17 (Tied) | Rising rapidly (up 13 places). |
| Singapore | 75 | Institutional & Stablecoin hub; Low grassroots rank. |
By any adoption metric, Indonesia looked like one of the most promising crypto markets in the world.
So why, by the end of 2025, were 72% of licensed local crypto exchanges unprofitable?
Why had domestic transaction value collapsed 69.6% from its 2021 peak — from IDR 859.4 trillion down to IDR 260.9 trillion — even as user counts grew past 20 million?
| Metric | 2024 (Baseline) | 2025 (Shift) | Change |
|---|---|---|---|
| Total Transaction Value | IDR 650 Trillion | IDR 482.23 Trillion | ▼ ~25.8% |
| Active Investors | ~18-22 Million | >20 Million | Stable / Slight Growth |
| Regulatory Body | Bappebti | OJK (Transitioned Jan 2025) | Stricter Oversight |
| Exchange Profitability | - | 72% Unprofitable | High Market Stress |
Why was the OTC market — theoretically the natural infrastructure layer for a maturing, high-volume market — shrinking instead of scaling?
I managed an OTC desk in Jakarta from 2023 through November 2025, handling settlement and reconciliation for a $300K+/day operation. What I learned wasn’t about better execution or smarter risk management — it was that the business model itself is being killed by structural forces that no amount of operational excellence can overcome.
Indonesia added crypto users while losing crypto volume. That divergence is the story.
This isn’t about incompetent operators. It’s about what happens when a market matures faster than its infrastructure, and when regulatory arbitrage makes it impossible for local players to compete on a level field.
By late 2025, Indonesia had slipped from 3rd to 7th in the Chainalysis index as users migrated to global platforms. The adoption was real. The infrastructure couldn’t hold it.
Part 1: The Liquidity Problem
The first problem is liquidity — or rather, its fragility at any meaningful size.
Indonesian exchanges live and die on a single trading pair: USDT/IDR (and to a lesser extent, USDC/IDR). These fiat onramp pairs account for the vast majority of trading volume on local platforms. Everything else — BTC, ETH, altcoins — is a rounding error by comparison.
Popular Trading Pairs in Indonesia (Sorted by Market Share).
| Rank | Trading Pair | Market Share (Approx.) | Description |
|---|---|---|---|
| 1 | USDT/IDR | 37.8% – 45.0% | The undisputed leader. Traders use this pair to enter the market, hedge against volatility, and access global liquidity. |
| 2 | BTC/IDR | 4.1% – 11.6% | The primary gateway for Bitcoin investment. It consistently ranks second but with significantly less volume than USDT. |
| 3 | ETH/IDR | 2.1% – 6.3% | The standard pair for Ethereum exposure. Ethereum remains a top-three asset by transaction value according to Bappebti. |
| 4 | XRP/IDR | 2.8% – 5.8% | A long-time favorite in Indonesia due to its low transaction fees and historical popularity in the region. |
| 5 | SOL/IDR | 3.3% – 3.9% | Solana has seen a resurgence, becoming a top-five traded asset due to its ecosystem growth and meme coin activity. |
| 6 | DOGE/IDR | ~1.7% – 3.8% | Dogecoin remains a staple for retail traders, maintaining significant volume during market rallies. |
| 7 | PEPE/IDR | ~2.3% | A newer entrant that has quickly climbed the ranks, identified by regulators as one of the top 5 assets by transaction value in late 2024. |
A snapshot of two local exchanges taken in February 2026 illustrates the problem directly.
On Tokocrypto — the most liquid local venue, backed by Binance — the USDT/IDR orderbook shows cumulative depth of approximately 1.5 million USDT on the ask side. This looks reassuring until you examine the structure: a single order at 16,871 IDR accounts for 264,595 USDT — nearly 18% of total visible depth at one price level. Remove the top three or four orders and the book thins dramatically.
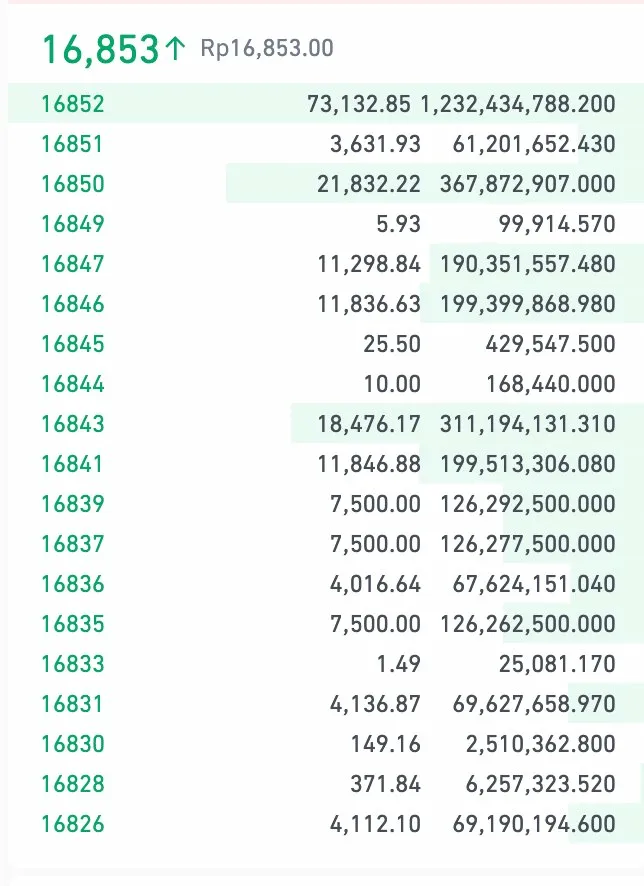
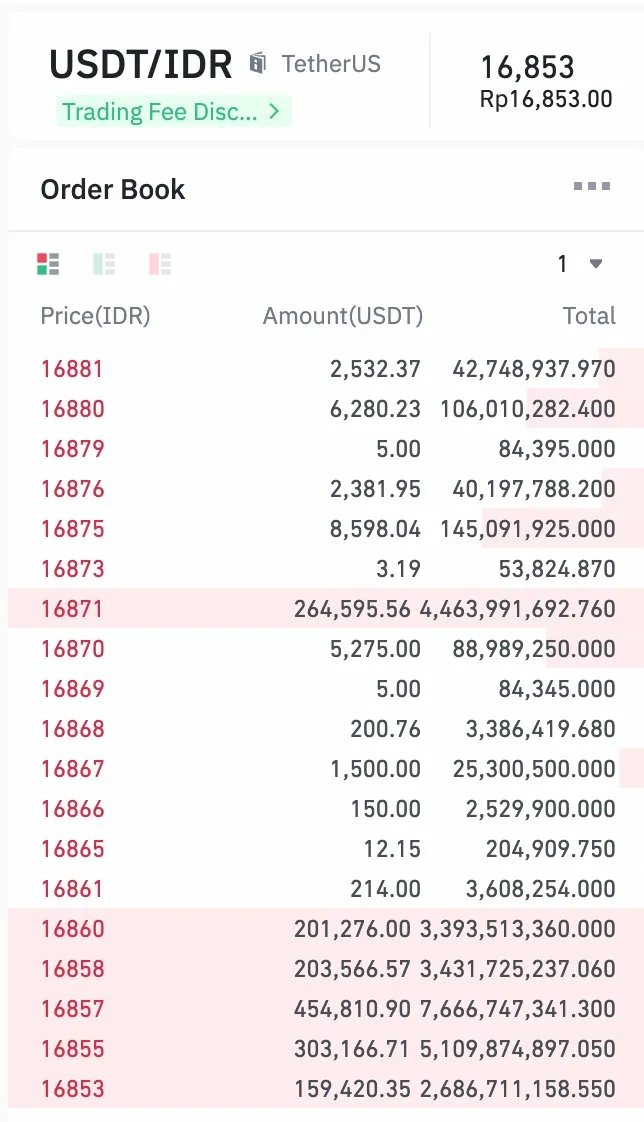
On Reku — a smaller but established local exchange — the picture is more honest. Liquidity is more evenly distributed across price levels, but total visible depth on both sides combined is approximately 175,000 USDT (~IDR 2.95 billion). A single 2 billion IDR market order (~119,000 USDT) would exhaust most of the visible book in one trade — not generating slippage, but simply running out of counterparties.
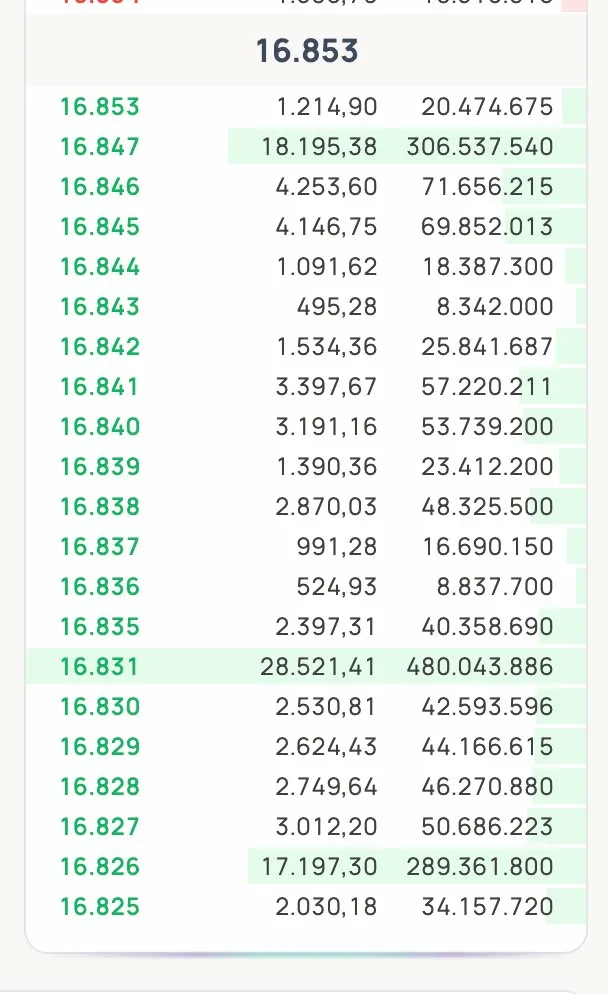
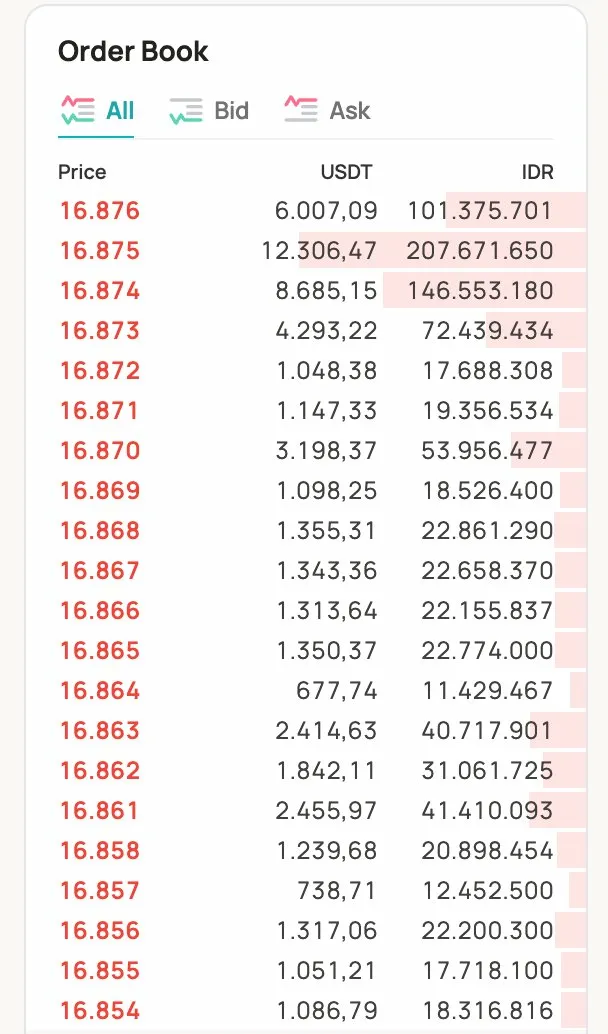
This distinction matters: Tokocrypto’s depth is real but artificially supported by its Binance parent. Reku’s orderbook reflects what the Indonesian market looks like without institutional backing. The gap between them is the gap between what local market depth looks like on paper and what it looks like in practice.
For a market order above approximately 2 billion IDR, execution on any local exchange either generates significant slippage — where depth exists but is lumpy — or simply fails to fill completely on smaller venues where depth is insufficient.
The depth chart tells one more story: bid liquidity (IDR buyers) is consistently thinner than ask liquidity (USDT sellers) across both exchanges. The market is structurally biased toward onramping — money flowing out of IDR into stablecoins — not two-way trading.
It’s a gateway, not a marketplace.
Part 2: The Capital Flight Problem
The numbers tell the story before the analysis does.
Indonesia’s domestic crypto transaction value collapsed from IDR 859.4 trillion in 2021 to IDR 260.9 trillion in 2024 — a decline of 69.6% over three years. By 2025, OJK data showed a partial recovery to IDR 482.23 trillion, but still far below peak levels.
[EVIDENCE: OJK data via 2024 Indonesia Crypto & Web3 Industry Report]
This isn’t just a bear market story. Bitcoin recovered substantially through 2024–2025. The domestic transaction decline is structural, not cyclical — and the reason is straightforward: Indonesian investors are leaving local platforms for international ones, and they’re not coming back.
Here’s what actually happens when a client needs to move serious size. They don’t use a local OTC desk. They don’t even stay on a local exchange. They onboard IDR through a local platform like Tokocrypto (owned by Binance) Nobi (owned by Bybit), convert to USDT, and move that stablecoin to the parent platform for all subsequent trading. Once holding USDT, they have access to global liquidity pools that are 10x to 50x deeper than anything available locally.
But it goes further than exchange trading. P2P platforms on Binance and other global exchanges have become the preferred channel for many Indonesian traders — offering direct bank transfers in under a minute, lower fees, and crucially, no Indonesian transaction tax on the trading activity itself.
This is a direct substitute for local OTC services. The value proposition is nearly identical — bilateral matching, bank transfer settlement, price certainty — but with global liquidity and regulatory arbitrage built in.
The acquisition strategy of international platforms makes the intent explicit. Binance didn’t buy Tokocrypto for its trading engine. Bybit didn’t buy Nobi for its technology. They bought regulated fiat gateways — the licensed IDR onramp infrastructure that lets them funnel Indonesian users onto their global platforms legally. The local platforms become utilities, and all the profitable flow leaves immediately.
The cost of this gap is measurable. The drain to unlicensed and offshore platforms is estimated to cost the Indonesian government between $70 million and $110 million in lost tax revenue annually.
[EVIDENCE: Tiger Research — “3 Changes in the Indonesian Blockchain Market”]
The verdict: by the end of 2025, 72% of licensed local crypto exchanges were unprofitable.
That’s not an industry in transition. That’s an industry being structurally hollowed out — from above by international platforms capturing sophisticated flow, and from below by P2P channels capturing retail flow that would otherwise stay local. Local OTC desks sit exactly in the middle of that squeeze.
Part 3: The Tax Asymmetry — The Kill Shot
But the real structural problem — the one that makes local OTC operations almost impossible to run profitably — is taxation.
This tax burden isn’t new. Since May 2022, Indonesia has taxed crypto transactions under PMK 68/PMK.03/2022, imposing a combined VAT and income tax burden totaling approximately 0.21% of transaction value. The latest regulation, PMK No. 50/2025 (effective August 2025), restructures the framework — reclassifying crypto from commodity to securities-like assets and standardizing the income tax rate at a flat 0.21% — but preserves the same practical burden on operators.
I operated this desk under both regulatory regimes: PMK 68/2022 from 2023 through July 2025, and PMK 50/2025 through my final months before leaving in November 2025. The policy changed. The practical burden didn’t.
If anything, the new regulation makes conditions marginally worse. The old dual-rate system (0.1% licensed vs. 0.2% unlicensed) at least incentivized operating through legitimate local infrastructure. The new flat rate removes that distinction entirely.
| Feature | PMK 68/2022 (Old) | PMK 50/2025 (New) |
|---|---|---|
| Crypto Classification | Commodity | Treated like securities |
| VAT on Crypto Transfers | ✅ Yes (1%/2% × VAT rate) | ❌ No (exempt) |
| Seller Income Tax Rate | 0.1% (licensed) / 0.2% (unlicensed) | 0.21% uniform |
| Foreign Platform Rate | Not specifically addressed | 1% final |
| Mining Income Tax | 0.1% final + general rates | General rates only (effective 2026) |
| Effective Date | May 1, 2022 | August 1, 2025 |
For a local OTC desk trying to charge a competitive 30 bps spread, the transaction tax alone consumes 21 basis points of the client’s cost — leaving the desk just 9 basis points of gross margin before covering staff, infrastructure, capital costs, FX risk, and counterparty risk.
Nine basis points.
Now compare that to the international platforms. When a client onboards through Tokocrypto and converts IDR to USDT, they pay the 0.21% tax once — at the onramp. Every trade after that — BTC/USDT, ETH/USDT, any stablecoin-denominated pair — happens on Binance’s offshore infrastructure. No Indonesian transaction tax applies.
The regulation technically requires sellers on foreign platforms to self-report and pay a 1% final tax — nearly five times the local rate. But enforcement across borders is practically nonexistent. PMK 50/2025 acknowledges this gap by allowing the Finance Minister to appoint foreign platforms as tax collectors — but until that appointment happens, compliance is voluntary, and largely absent.
So in practice, Binance can offer deeper liquidity, tighter spreads, better execution, and a lower all-in cost — while still making more margin than a local OTC desk ever could.
This isn’t a fair competition. It’s regulatory arbitrage with a licensed front door.
I watched the regulation change in real time. The tax restructured. The competitive disadvantage didn’t move an inch.
Part 4: The Warehousing Problem
Even if the tax structure weren’t prohibitive, there’s another issue: local OTC desks operate with no warehousing.
In a healthy OTC market, desks hold inventory. They buy low, sell high, and use their balance sheet to smooth out timing mismatches between buyers and sellers. This is how they provide genuine value — guaranteed pricing, instant execution, and the ability to handle size without waiting for a counterparty.
But in Indonesia, most OTC desks run a pure matchmaking model. They don’t hold positions. The reason is intuitive: IDR depreciates structurally against the dollar.
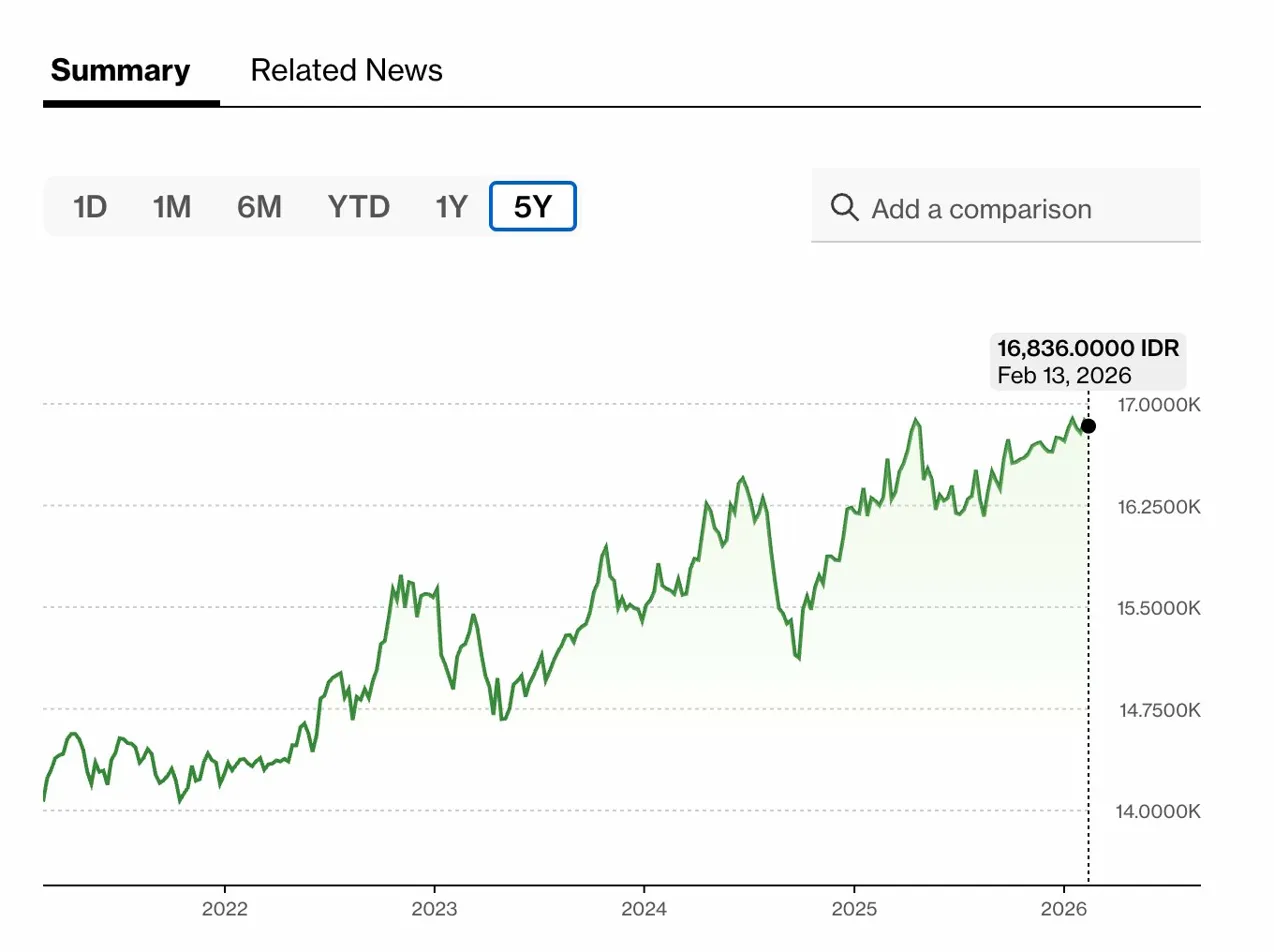
Over the past five years, IDR has weakened from approximately 14,000 to 16,836 per USD — a depreciation of roughly 20%, with the trend accelerating through 2025 into 2026.
For a desk whose clients think in IDR but whose inventory is denominated in USDT, this creates a permanent FX headwind: every dollar of USDT inventory becomes more expensive to replenish in local currency terms as IDR weakens. The instinct is to avoid that risk entirely — don’t hold inventory, just match buyers and sellers in real time. It feels like prudent risk management.
But it isn’t. It’s trading one risk for another.
A desk without inventory can’t lock in client pricing. It has to source USDT on-demand at whatever the market offers at execution time. In a thin orderbook, that means absorbing slippage. In a fast-moving market, it means the price quoted to a client may be impossible to honor by execution time.
The desk avoided balance sheet risk and walked straight into execution risk instead.
The result: OTC desks can’t actually deliver the core value proposition of OTC — price certainty, size execution, convenience. They’re forced to operate as brokers adding a spread on top of worse liquidity than the client could access themselves.
This isn’t a temporary bear market problem. The IDR depreciation trend predates the crypto bear market and has continued through the subsequent recovery. A bull run doesn’t fix a structural currency problem.
Part 5: The Race to the Bottom
The following is based on direct operational experience managing an OTC desk in Jakarta through 2023–2025. No public data captures this dynamic — which is itself part of the story.
Faced with declining volume and shrinking margins, local OTC desks responded predictably: they moved downmarket.
During my tenure, minimum ticket sizes that had historically sat at 1–2 billion IDR began dropping. Some desks began competing for transactions as small as 100 million IDR — trades that any retail exchange handles more efficiently, more cheaply, and with better UX than an OTC desk ever could.
This wasn’t just a 2023-2025 phenomenon. As of February 2026, Indonesian OTC desks were still publicly advertising 100 million IDR minimums — a signal that the race to the bottom not only continued after I left, but accelerated.
The logic is understandable. Smaller tickets mean more transactions, more fee events, more activity on the surface. But the economics don’t work. Nine basis points of gross margin on a 100 million IDR trade (~$6,300 USD) generates roughly $5.67 in revenue per transaction, while each trade still requires full KYC verification, settlement, reconciliation, and counterparty management. Operational cost per trade doesn’t scale down with ticket size.
The desk was essentially paying full operational overhead to process transactions that should never have reached an OTC desk in the first place.
This dynamic isn’t captured in public market data — OTC desks don’t report ticket size distributions to regulators or industry bodies. What it reflects is the operational reality of managing a desk through a structural decline, and the quiet desperation that precedes market consolidation.
This is the terminal signal of a structurally broken market: when the players competing for the smallest, least profitable trades are the ones who were supposed to be serving the largest, most sophisticated clients.
The market didn’t just shrink. It inverted.
The Structural Lesson: This Isn’t Unique to Indonesia
None of this is unique to Indonesia.
Any emerging market crypto ecosystem will hit the same failure mode when four conditions are present simultaneously: domestic liquidity is thin and concentrated in fiat pairs with limited two-way flow; the regulatory tax burden is asymmetric, with local transactions taxed while offshore trading remains practically unenforceable; international platforms have superior capital and infrastructure; and cross-border flow is frictionless, which stablecoins have made trivially easy.
When all four conditions are true, the same death spiral plays out. International platforms capture sophisticated flow through local onramp acquisitions. P2P channels capture retail flow. Local OTC desks get squeezed into a shrinking middle band — too large for efficient exchange execution, too small to justify international platform complexity — with margins that can’t support the operational infrastructure required to serve them.
The local OTC desks that survive won’t be the ones with better operations. They’ll be the ones that can operate across jurisdictions — bridging local fiat markets and international liquidity pools, rather than being trapped inside a single depreciating currency with asymmetric tax treatment.
The winning model isn’t “be a better Indonesian OTC desk.” It’s “be an international desk with Indonesian market access.”
That’s the structural reality I learned managing settlement and reconciliation through a declining market. The business wasn’t failing because of execution risk or poor management. It was failing because the economics were designed to fail.
Closing: What Operational Excellence Actually Teaches You
I built a zero-discrepancy reconciliation system for this desk using Power BI, automated cash flow tracking across multiple wallets and exchanges, and handled settlement for $300K+/day in volume. The operations worked.
But operational excellence doesn’t overcome structural disadvantage.
What I learned was how to diagnose why a market is broken — not just how to operate within it. How to read the gap between adoption metrics and infrastructure health. How to see regulatory arbitrage before it hollows out a market. How to understand that a business failing isn’t always the fault of the people running it.
That’s a harder, more valuable skill than execution. And it’s one that applies to any market where regulatory friction, capital constraints, and competitive asymmetry determine outcomes more than operational quality.
If you’re building in emerging markets, navigating cross-border liquidity, or trying to understand why local crypto infrastructure keeps losing to global platforms — this is the pattern to watch for.
I’ve lived it.
Author is a former OTC desk senior trader and market operations specialist based in Jakarta. This piece reflects personal analysis and operational experience and does not represent the views of any former, current or future employer.


.jpg)